
See also


 16.11.2026 02:41 PM
The EUR/USD pair continued to decline on Friday after consolidating below the 1.1081–1.1086 support level, moving toward the next support level at 1.0939–1.0944. There are currently no signs that the decline is coming to an end. The reasons behind last week's sharp decline in the European currency can be debated at length, but the technical picture provides a clear explanation.
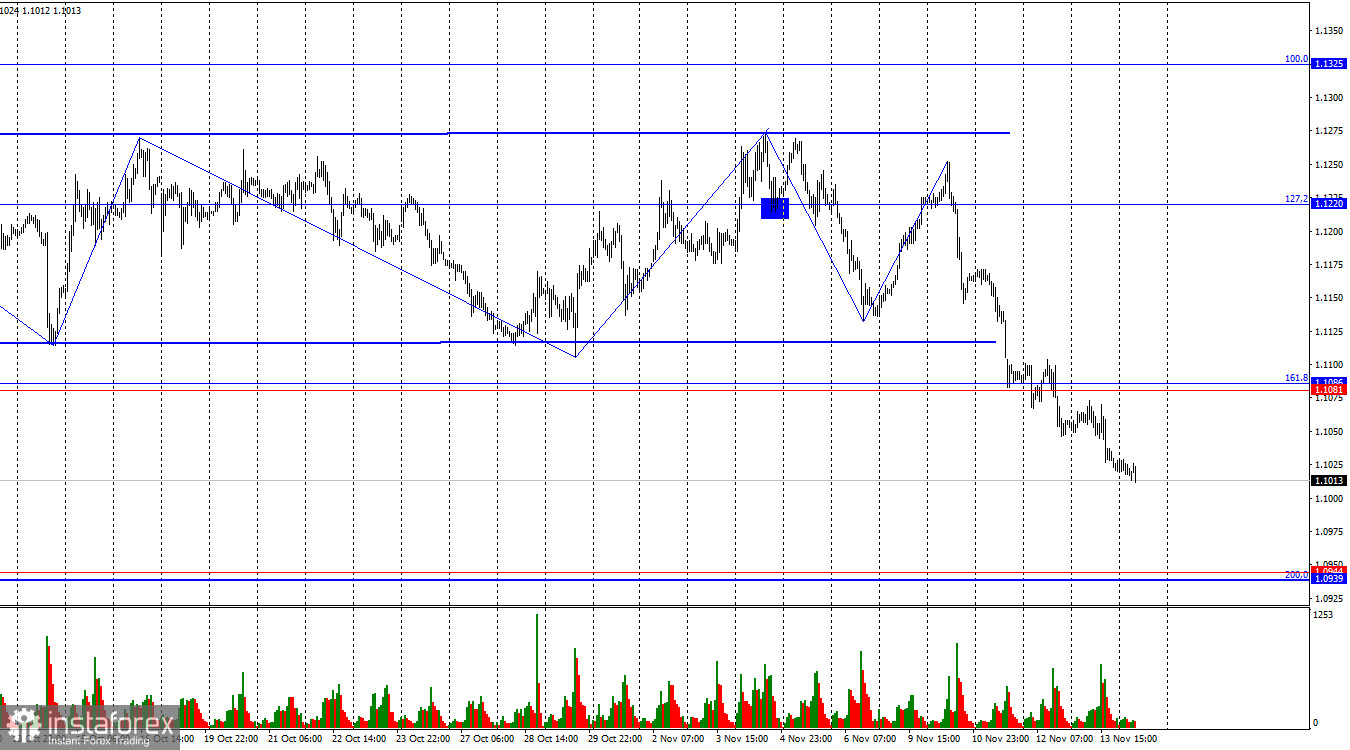
The wave structure on the hourly chart remains bearish. The latest completed upward wave failed to break above the previous peak, while the new downward wave broke below the previous low. Following the September FOMC meeting, traders expect at least one more monetary policy tightening before the end of the year and anticipate the possibility of two additional tightenings next year. This factor continues to support the US dollar, while US economic data further increase the likelihood of the most hawkish scenario materializing.
The news background on Friday gave bears an opportunity to take a short break, at least on the final trading day of the week. However, even that failed to materialize. European GDP provided some support for bulls, but the positive impact was limited. The European economy grew by just 1.3%, exactly in line with market expectations. At the same time, employment remained unchanged in the third quarter, indicating no expansion in the labor market. The data released on Friday cannot be described as weak, but neither can they be considered particularly strong. The market preferred to focus on another US inflation report, but this report also failed to trigger the expected reaction. This is because traders continue to interpret economic data from an unusual perspective compared with normal market conditions. EU GDP and employment figures were not strong enough to justify expectations of changes in the economy or the ECB's monetary policy. US producer price data were not weak enough to suggest a slowdown in headline and core inflation. Therefore, Friday's reports made virtually no difference to the overall economic outlook or market sentiment.
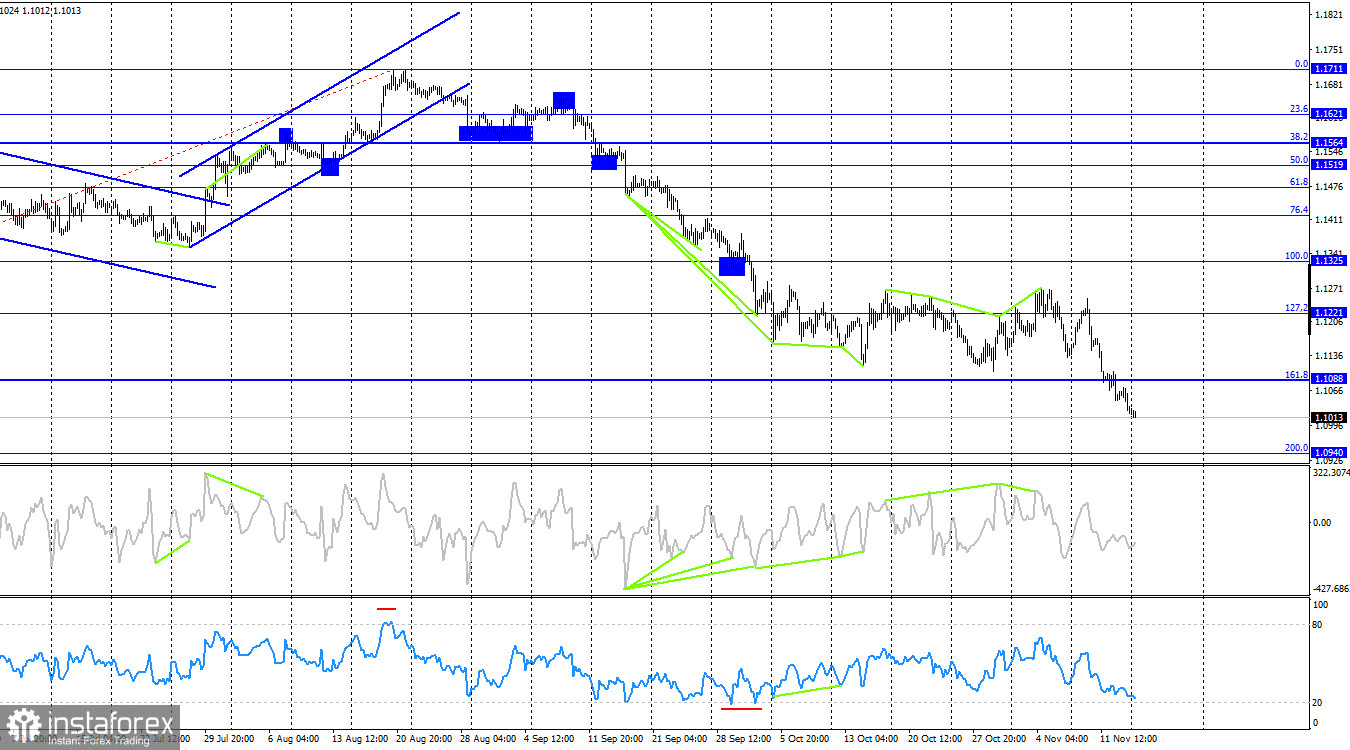
On the 4-hour chart, the pair reversed in favor of the US dollar and consolidated below the 161.8% Fibonacci level at 1.1088. Consequently, the decline may continue toward the next corrective level of 200.0% at 1.0940. Consolidation above 1.1088 would allow traders to consider a potential recovery toward 1.1221. No emerging divergences are currently visible on any of the indicators.
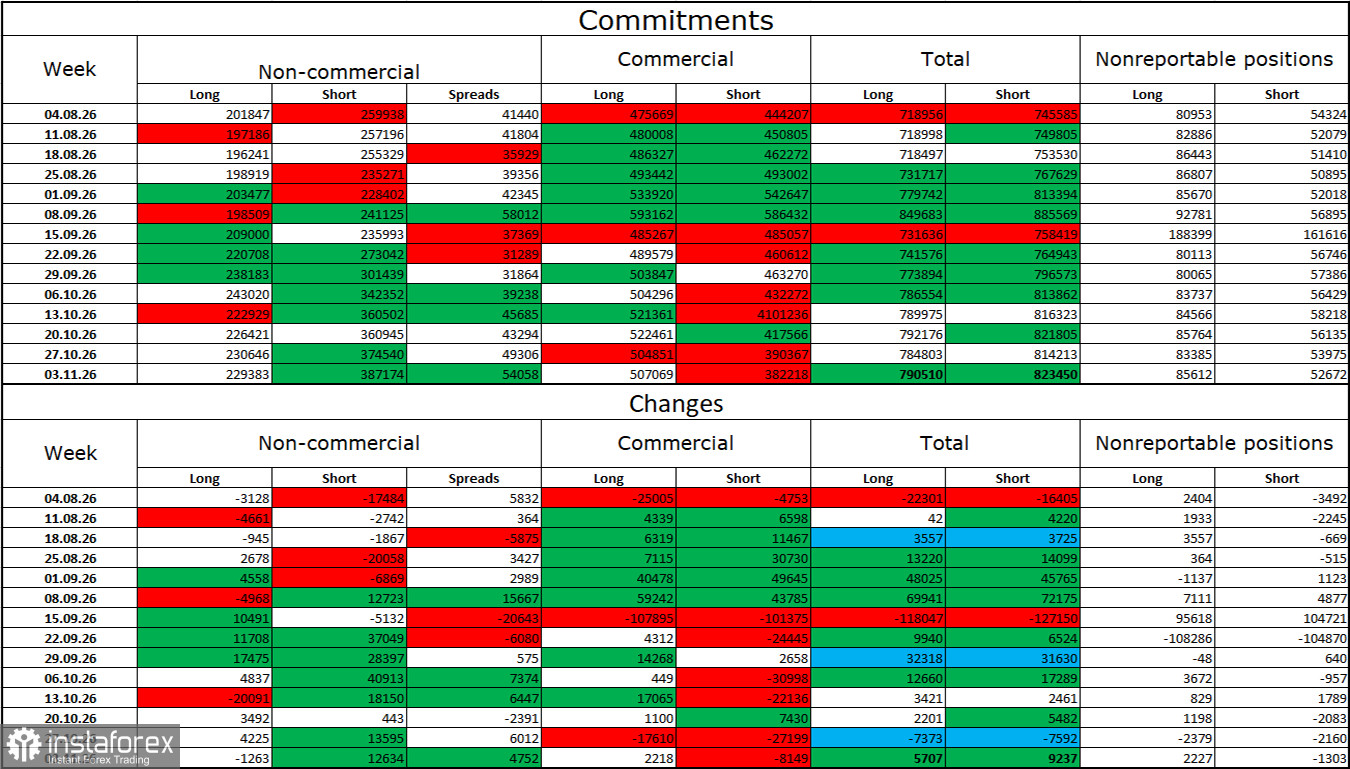
During the latest reporting week, professional traders closed 1,263 Long positions and opened 12,634 Short positions. The total number of Long positions held by speculators currently stands at 229,000, while the number of Short positions amounts to 387,000. Bears remain in control, and the European currency continues to be sold more frequently than it is bought. This is attributable to the challenging geopolitical situation in the Middle East and the Fed's willingness to continue tightening monetary policy. The market believes that the Fed will keep raising interest rates for as long as necessary.
Overall, large market participants continue to show considerable interest in the euro over the long term. Undoubtedly, various global events, which have been abundant in recent years, affect investor sentiment and put pressure on risk-sensitive currencies. Moreover, 2026 could set a record for the number of unpredictable events. Therefore, the European currency is waiting for a more favorable opportunity.
The economic calendar for November 16 contains two events, and Warsh's speech is one that traders cannot afford to overlook. The impact of economic developments on market sentiment on Monday is likely to be very limited or nonexistent.
Long positions in the pair are possible if the hourly chart closes above the 1.1081–1.1086 level, with a target of 1.1220. Short positions were possible following consolidation below the 1.1081–1.1086 level on the hourly chart, with a target of 1.0939–1.0944. These positions can remain open.
The Fibonacci grids are drawn from 1.1325 to 1.1712 on both the hourly and 4-hour charts.


