
Lihat juga


 16.11.2026 09:02 AM
Bitcoin plunged below $62,000 over the weekend before recovering to levels around $65,000. The wave of selling triggered $2.02 billion in liquidations over 24 hours, approximately $750 million of which involved Bitcoin, with long positions accounting for the bulk of the losses. Ethereum is trading around $1,800, down roughly 18% over the past week, while Strategy and BitMine have once again slipped into multibillion-dollar unrealized losses alongside the broader market.

The scale of the losses suffered by the two largest corporate holders becomes clear from a few simple calculations. Following its purchase of 1,036 BTC on November 9, Strategy's holdings reached 850,364 BTC, at an average acquisition price of approximately $75,450. With Bitcoin trading around $65,000, its unrealized loss is approaching $8.9 billion. Back on November 9, when Bitcoin closed below its cost basis for the first time since August 20, the loss stood at approximately $800 million. At the end of September, however, fair value still exceeded the company's acquisition cost, and Strategy reported a $4.1 billion tax benefit. Its dollar reserve has meanwhile declined to $4.9 billion, compared with approximately $7 billion in September, although the company is under no obligation to sell Bitcoin simply because its price falls below its cost basis.
As of November 9, BitMine held 6,070,092 ETH, equivalent to 4.97% of the total supply, with approximately 5.23 million ETH staked. For the financial year ended August 31, the company reported a net loss of more than $6.3 billion, compared with a profit of $348.6 million a year earlier. Based on my estimate of an average acquisition price of approximately $3,400 per ETH, its unrealized loss is now approaching $10 billion.
Over the weekend, BitMine Chairman Tom Lee outlined four reasons that, in his view, are weighing on the crypto market. The first is that investors are selling crypto to meet margin calls on Big Tech stocks, particularly following the decline in Nvidia and other AI-related shares. This has primarily affected retail traders in Asia. The second is that investors are selling both stocks and cryptocurrencies to free up capital for participation in the upcoming Anthropic IPO, with the offering price set to be determined on November 18 and trading scheduled to begin on November 19. The third factor is that Binance customers who received compensation following the hack are converting the crypto they received into cash and stablecoins. The fourth is that a growing number of hacks, against the backdrop of advances in AI, have triggered renewed concerns across financial markets.
Importantly, Tom Lee has not quantified the contribution of any of these factors. Moreover, on November 3, when Bitcoin was trading around $80,500, he declared, "We are at the bottom," and maintained that selling pressure related to the Binance hack had already run its course. Now, however, Binance reimbursements feature among the reasons for the market decline. This contradiction with his earlier position is noteworthy.
The available facts partly support his explanation. On November 12, Nvidia's board of directors removed Jensen Huang from his position, while the company's shares fell more than 14% that day. Nvidia's earnings report is due on November 17. Demand for Anthropic's IPO has reportedly exceeded the available offering several times over, with its valuation being discussed at $1.5 trillion or higher. Meanwhile, on November 12, Binance announced that it had completed the full reimbursement of $6.3 billion.
However, what stands out most is institutional investor behavior. US spot Bitcoin ETFs have recorded seven consecutive sessions of net outflows, totaling approximately $1.91 billion over that period. Another $185.4 million flowed out on Friday alone, including $143.5 million from IBIT.
It is also worth noting that Friday's Producer Price Index came in below expectations, at 0.3% versus the forecast of 0.4%, yet Bitcoin went on to set new lows. This suggests that liquidity flows, rather than macroeconomic data alone, are driving the pressure. At the same time, a 25-basis-point Federal Reserve rate hike on December 9 is already priced into the market and is doing little to improve the overall backdrop.
In my view, market pressure is likely to persist until Anthropic's IPO on November 19 and Nvidia's earnings report on November 17. A retest of the $60,000–$62,000 support zone looks increasingly likely. If this support fails to hold, the next reference point will be the July low of approximately $58,570, while Strategy's and BitMine's unrealized losses could increase by several billion dollars.
A recovery above $67,800 would require ETF outflows to come to a halt, and there are currently no signs of that happening. Even if a rebound occurs, I expect it to be short-lived. A sustained reversal is possible only after capital withdrawals ahead of the IPO have run their course and leveraged positions have been reduced.
Technical analysis and trading recommendations
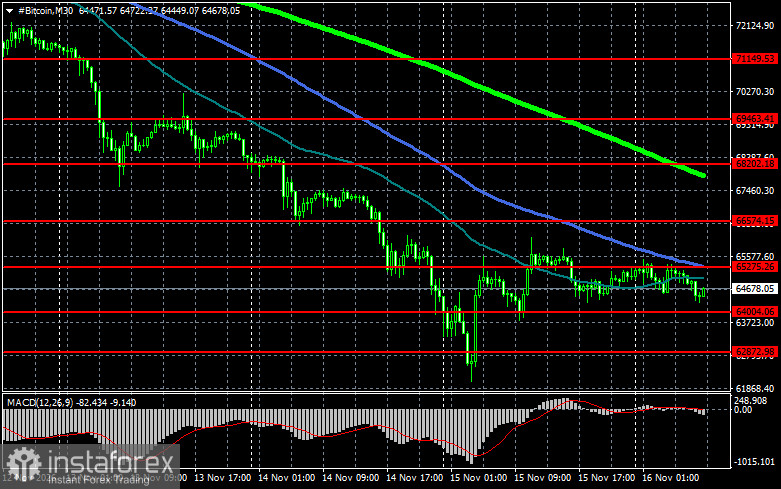
Bitcoin
As for Bitcoin's technical outlook, buyers are currently targeting a recovery above $65,300. A successful move above this level would open the way toward $66,500, bringing the market within reach of $68,200. A break above the latter would signal an attempt to restore the bullish market structure.
If Bitcoin declines, I expect buyers to step in around $64,000. A move back below this level could quickly send BTC toward $62,800. The next and most distant downside target is the $60,600 area.
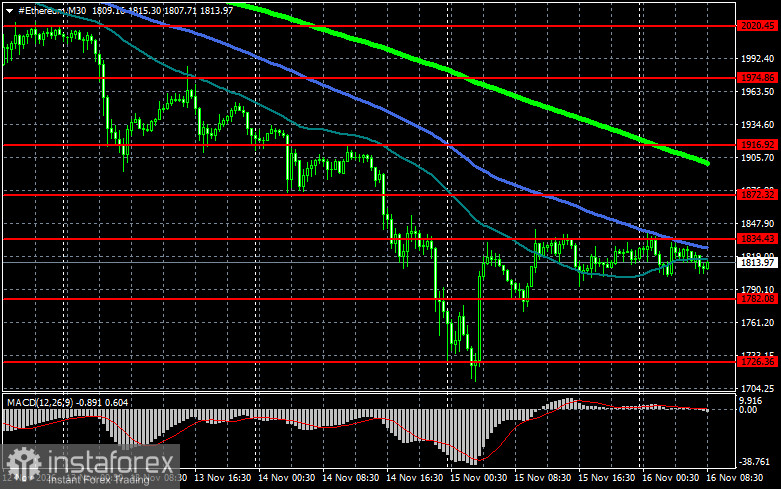
Ethereum
As for Ethereum's technical outlook, a decisive move and consolidation above $1,834 would open the way toward $1,872. The next and most distant upside target is the $1,916 area. A break above this level would signal strengthening bullish sentiment and a renewed return of buyer interest.
If ETH declines, I expect buyers to step in around $1,782. A move back below this level could quickly send ETH toward $1,726. The next and most distant downside target is the $1,650 area.
Comments on the chart
Price testing or crossing any of these moving averages often either halts movement or injects fresh momentum into the market.


